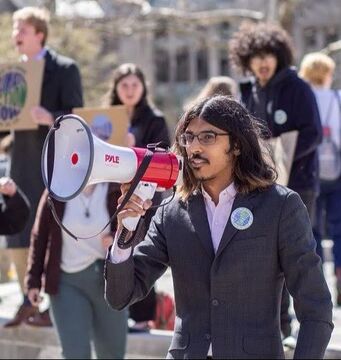
 Hi all, my name is Sidd, a senior studying environmental science and geography! A lot of my time at IU has been spent organizing around environmental and social justice, such as with the Graduate Workers Union and Students for a New Green World (SNGW). Throughout my years here, I’ve gradually learned a few strategies for successful organizing, and I’d like to share these here for anyone to pull from!
One of the first actions that any successful movement I’ve been a part of has done is to establish some form of structure. This ranged from creating a clear hierarchy of leadership positions to committing to a non-hierarchical structure with tasks delegated to members to complete. No matter what structure was decided on, we always clearly delegated tasks to people or groups to ensure that everyone knew who to communicate with about each action. Consistent meeting schedules and decision-making processes also made our organizing more effective. There was never one specific structure that worked for every movement; instead, we would create it depending on the goal, size, and other factors of the movement. The next element that allowed us to grow and maintain our movements was a commitment to values or goals. Throughout my experience, the more specific and tangible the goals were, the more committed we were to them. For example, SNGW listed out demands in response to the community being uncertain what our goals were; after writing demands such as the need for “a climate action plan crafted collaboratively between students, staff, and faculty” that includes “a plan to reach carbon neutrality by 2040” at IU, the movement brought in more support from a broader community. Other examples of the effectiveness of shared goals can be seen with the collaboration between students with the Respect Workers group and other labor groups on campus to push IU to provide relief checks to all university workers during the COVID-19 pandemic; the shared tangible goals facilitated those partnerships between student workers and other labor groups on campus to make their success possible. Tangible goals gave us something specific to work towards, maintaining our movements over long periods of time. The last suggestion that I’d like to share is the importance of a sense of place. I never realized the significance of this until my last year of organizing with Students for a New Green World. The Food Institute provided us with a space for our weekly meetings that we could all consistently return to. This built familiarity and comfort with our location during our meetings, resulting in members returning more consistently than before. A shared space can be extremely helpful for maintaining movements and facilitating healthy activism by providing organizers a comfortable place to discuss their movements as needed. My experience as an organizer on campus has been extremely fulfilling, but it was difficult to retain knowledge from previous organizers as they left Bloomington over time. I hope that this post can serve to fill that gap as my peers and I graduate and phase out of IU.
0 Comments
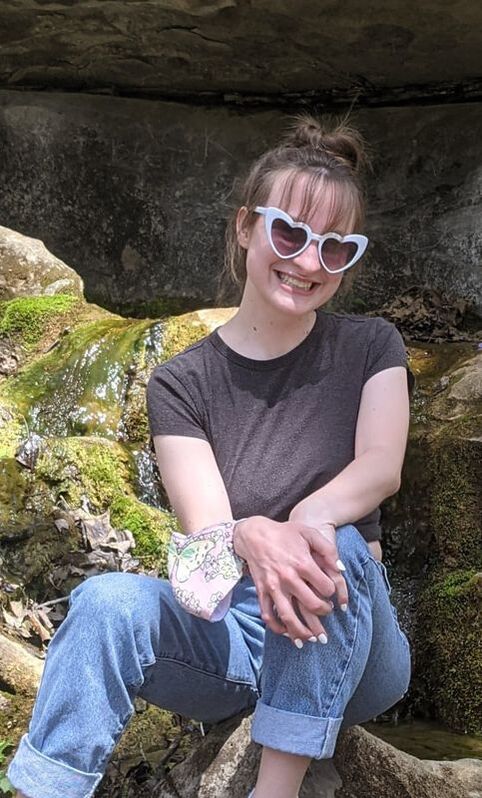 Hi all! My name is Lucy Lippman, and I’m a junior at IU studying mathematics, economics, geography, and French. I’ve been passionate about sustainability since my high school environmental science class, and joining the Critical Food Studies lab during my sophomore year has shown me how just and local food systems coexist with environmental sustainability in the state.
Last fall, I was admitted into the Sustainability Scholars program, and I worked with Dr. Shellye Suttles, Dr. Angela Babb, and Claire Frohman on a paper exploring the history of diversity and effects of discrimination in the Indiana food system. Specifically, I’ve been looking at metrics from the Bureau of Labor Statistics (BLS), the Census, the Department of Agriculture (USDA), and other national agencies for data on food system employment and food assistance program participation by race, ethnicity, and gender. For the most part, the methodology I’ve been following comes from a document by the Michigan State University (MSU) Center for Regional Food Systems. To understand trends in food system employment across demographics, a lot of MSU’s metrics revolve around wages. Unfortunately, relevant data on wages and demographics are published only nationally, not at a regional or state level. To best understand employment trends by race, gender, and ethnicity in Indiana, we created the Specific Occupation Adjusted Percentage (SOAP) Index to illustrate the difference between the percentage of a demographic in an occupational field and the percentage of that same demographic in the entire Indiana labor force. For instance, in 2010, 3.37% of all workers in food preparation and serving-related occupations, as defined by BLS, were Black men, while Black men made up 3.13% the Hoosier labor force at that time. The resulting SOAP index is -.24%. The small magnitude denotes no large difference between the Black male composition of the workforce and of food preparation and serving-related occupations, while the negative signage indicates the given demographic is more represented in the Indiana workforce than in the specific occupation. Large magnitudes and positive signages represent the opposite. The SOAP Index evaluates for equity, presuming that an equitable employment system will not exhibit large differences between the composition of the labor force and the composition of workers in specific occupations. It assumes freedom of choice, of mobility, and of cultural axioms that would otherwise impact the demographic compositions of certain occupational fields. This semester, I’m continuing work on the diversity metrics paper, fine-tuning my work from last semester and making it more cohesive with Shellye’s, Angela’s, and Claire’s work on the subject. I’ve also joined Dr. Knudsen on a working paper observing service accessibility in the rural Indiana Uplands. I look forward to continuing with the Critical Food Studies Lab, researching inequity in Indiana. 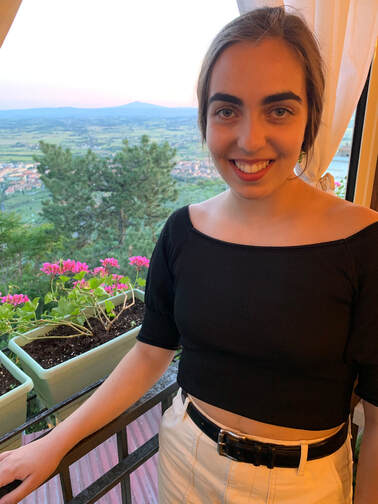 Hey everyone! My name is Isabella DeMarco and I am a Sophomore here at IU studying International Studies and Environmental and Sustainability Studies. I joined the Critical Food Studies lab this January 2021 and have really enjoyed getting to know other individuals passionate about the intersection of food and social justice.
At the beginning of Fall 2020 I was admitted into the Sustainable Scholars program run out of the IU Office of Sustainability. I was assigned to a project working alongside the amazing faculty members, Dr. Angela Babb, Dr. Julia Valliant, and Dr. Kurt Waldman, all affiliated with Sustainable Food Systems Science. Our project is designing an antiracist research platform to study racial equity within the Indiana agricultural system. Although the project is constantly evolving, we intend to produce an annotated bibliography and a collection of pilot interviews with African American farmers in Indiana. The annotated bibliography will include a list of literature on the historical and present day experiences of BIPOC farmers in Indiana. The pilot interviews seek to decipher what is being left out of research on Black farmers in Indiana, and also give us insight into what needs to happen in future research regarding the topic. As expected, the annotated bibliography process has been less fruitful than we would have hoped. Using the PSALSAR literature review method, we have found that many sources available on search engines such as Google Scholar, ProQuest, the Indiana University Libraries and many other databases do not specifically address our research topic. There is literature on racial discrimination within the United States agricultural system as a whole; however, few sources focused on this issue in Indiana exists. This notion has been brought up in the pilot interviews with Black farmers from around the state. We have currently interviewed five farmers, and each have echoed the claim that there is a severe lack of research into racial discrimination of BIPOC farmers in Indiana. Although the research community may not yet be aware of or acknowledge the underlying issues these farmers have faced in the past and are still facing now, every individual I spoke with is involved with one or more projects promoting BIPOC individuals and communities in agriculture. Owning land and farming for these African American individuals serves a form of resistance and resilience. Learning about these individuals farming stories has been incredibly enlightening and uplifting, but it also underlines the crucial need for their stories to be heard and the oppressive system to be changed and exposed. I look forward to continuing to learn more about how research can contribute to addressing this need for justice. 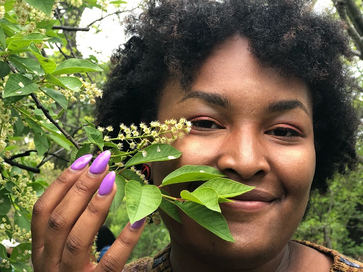 Hello all! I’m Isis, a senior at IU, doing research in the Critical Food Studies lab. As a new lab attendant, I've been honored to work alongside incredible mentors and students who have introduced me to critical issues involving the food system, especially in Southern Indiana. As Black History Month comes to an end, I want to share about a journal article I am helping to write. The “White Supremacy at the Bloomington Community Farmers Market” piece, coauthored by Dr. Angela Babb and Megan Betz, details issues pertaining to the local food and agriculture system in Southern Indiana, as well as the residents of Bloomington.
The goal of our article is to discuss the presence of white supremacy within the local food system, beyond the specific and significant issues that arose with the Bloomington Farmers Market in 2018. The appearance of white supremacy is part of a larger, painful history of systemic racism, which has colonized the food system and facilitated even greater food insecurity. The introduction of hate groups, inspired by white supmacist beliefs, has left marginalized residents of Bloomington feeling unsafe. One of the topics we also plan to elaborate on within the paper includes nostalgia surrounding farmers markets and local food. Nostalgia in the food system continues generational knowledge, at times nostalgia removes historical relevance. Agriculture, and the food system within the United States, historically has been shaped by Indigenous and Black communities. After colonization, food began to be taken over by Europeans, who did not respect the land. Now, many of those who are leading farmers are typically descendants of those colonizers and settlers, taking away space and land opportunity from BlPOC (Black, Indeginous, People of Color). Other topics in the paper include public safety regarding the presence of hate groups affiliated with white supremacy, first amendment protections, and attention to community hate groups. Overall, the research for the article has involved readings to understand white supremacy in Southern Indiana, as well as coding content for Nvivo and retaining useful information for dismantling white supremacy in the local food system. Looking to find ways to unsubscribe from and dismantle white supremacy? Thanks to diligent community members such as Dr. Angela Babb, farmers markets with the purpose of equality and accessibility have created a safe space for marginalized community members to buy local food. Examples of these markets in the community include the Peoples Market and the Plant Truck.  by: Kamila Czebotar
I’ve been working with the Critical Food Studies lab since October of 2019; while most of my work at the lab has been assistive, from data digging to paper reviewing, I am also positioned between the critical food studies lab and the Sustainable Food Systems Science team. I am currently working with the “Complex Food Provisioning Strategies and Food Insecurity among Low-Income Older Americans” project. Our main research objectives are determining what food insecurity looks like in older Americans, how different times of the year (as well as changes throughout their lives) affect food security, and what food programs around local and rural south-central Indiana exist and how they might be improved. As part of this work, I was involved in attending focus groups in 4 different counties with service providers and seniors in the area, and from these groups I gained a better understanding of how food insecurity affects seniors. One major finding I have taken away from the focus groups is how physical barriers affect food insecurity, including personal health issues (like mobility or chronic diseases) as well as physical access (for example transportation); Other important issues came up, such as the financial accessibility of food and how living alone affects eating habits. Through all these and other obstacles, however, seniors in south central Indiana have adapted to these common food insecurity issues by supporting each other in number of ways, including sharing meals and rides, learning how to adapt to income differences through stretching food, sales, and the use of food pantries, meal sites, and SNAP. Lastly, we gained information on the problems and recommendations of local assistance programs, including the loss of meal sites, rules that restrict services, and critiques of the quality of foods offered in these programs. After attending these focus groups my work involved creating summaries and transcribing the audio for further analysis, and headway into the next phase of the project: coding the transcripts through Nvivo and working with a smaller team to compare findings and outline the main themes of the focus groups. As we have wrapped up the focus groups our next phase involved creating and sending out surveys to a larger population of older Americans in rural Indiana. In the midst of creating the survey, COVID-19 hit Indiana and our team decided to include questions relevant to circumstances before and during the COVID-19 crisis to better understand the impact the virus has on food security amongst seniors. We hope to gain more information through the survey answers as well as the post-survey interviews we plan to conduct this summer. While working with this team I have learned many new skills like qualitative analysis of transcripts, holding focus groups, and creating a survey; I hope to continue gaining skills as we further our research this summer and fall.  Hi! My name is Oliver Allen, but most people call me Mel. I’m a second year student studying Computer Science and Math with a minor in Art History, and I also play marimba when I’m not studying or writing programs. I started working at the Critical Food Studies Lab in January of 2019 doing basic statistics, but now I am focused on applying my skills in computer science and machine learning to analyze data surrounding food justice and sustainability.
I started the semester by working with Lab Director Angela Babb to create a dataset of average food consumption and nutrient profiles to assist in analysis of the Thrifty Food Plan calculation. The Thrifty Food Plan is the basis of how the USDA allocates Supplemental Nutrition Assistance Program (SNAP) benefits to over 42 million people annually, but the latest released calculation was done with data from 2001, which is nearly 20 years old. In order to perform a relevant analysis of the Thrifty Food Plan calculation we needed an updated dataset of food consumption and relevant nutrient profiles for each of the foods in the USDA Dietary Guidelines for Americans. I had to approximate the dataset used by the USDA with something built from publically available data, so I ended up downloading all of the responses to the National Health and Nutrition Examination Survey (NHANES) for 2015-2016 and working with the data in R to separate it into each of the age-sex groups specified by the Thrifty Food Plan. Each row was a food group (for example provolone cheese, roast beef, Dippin’ Dots, etc.) and there were two columns representing national consumption data and then information on the food’s nutrient profiles. Eventually we had a dataset that could at least in part approximate the one used for the Thrifty Food Plan calculation and facilitate further analysis of the USDA’s model. In the latter half of the semester I worked to apply machine learning techniques to data about behavior surrounding switching to a sustainable diet. I used data from a survey given by the Sustainable Food Systems Science research group at IU to approximately 500 heads of households in Indiana, and I implemented a machine learning model to predict behavior around switching to a sustainable diet from demographic data. I also used this model to analyze which demographic features are most important when deciding whether a person will switch to a sustainable diet or not, or whether they will switch gradually over time versus switching quickly due to an event or crisis. I built additional models for each of these problems to further analyze the influence of each feature in the prediction, and I hope to continue looking into applications of machine learning with data around food security and sustainability to gain insight into why people make the choices they do surrounding food and diet.  I started working with the Critical Food Studies Lab in January 2019 and since then I have been involved in several different projects including gap year student Belen Roger’s Food Choice Project. This year, I have been focused on my Senior Thesis in Geography which combines historical and geographical qualitative research to uncover how spaces have evolved within the food industry to persistently devalue labor. It questions how individuals within this industry navigate living on a wage that is not equal with the cost of living in Bloomington, Indiana. With the food service sector employing 10% of Bloomington, Indiana’s working population and the mean hourly wage being $10.78, it is critical to analyze how this population depends upon social benefit programs and how they work through the Cliff Effect Phenomenon.
I conduct interviews of Bloomington residents working in the food service sector to determine how they navigate cliff effects within this specific work environment. Additionally, I analyze the growth of this sector through space and time in Bloomington with the help of historic maps and city directories from the 1950s to the 2000s to observe how it matches with the rise of the cliff effect of poverty as social benefits were instituted. I utilize one local tool, Indiana’s Self-Sufficiency Standard, and MIT’s living wage calculator in order to question how implementing a living wage that considers geographical variation of poverty thresholds would tackle ‘cliffs’ of poverty for those in the food industry in Bloomington, Indiana. I tie this question into urban development patterns in Bloomington regarding the locations of fast food in order to glean information about the value of food and labor in a mid-size, midwestern town. The lab has played an integral part to my motivation in this endeavor and has helped me think critically through problems I have come across in my research. I was able to send out my literature review and receive helpful feedback on gaps I may have not included, and they gave constructive feedback on ways to help improve the overall flow of the paper. It is encouraging and exciting to gather each week to share progress on our projects or hiccups we have come across and, in the end, it sharpens all the lab members involved. I know the skills I have learned through my time in the Critical Food Studies Lab will be crucial to the line of work I enter into and it will also open doors for important work in the future.  Hello! My name is Marie and I’m currently a third year student studying Environmental and Sustainability Studies with a concentration in Sustainable Food Systems. I’m also working toward certificates in Geographic Information Systems and Global French Studies.
Currently, I am researching institutional purchasing habits with my advisors, Jodee Ellett and Angela Babb. Last fall a survey was sent out through qualtrics to Indiana institutions such as K-12 schools, universities and colleges, hospitals, and correctional facilities. The survey included questions about how many people the institutions feed as well as how much money they spend annually. The survey then inquiries about local food purchasing and how often institutions are considering where their food is coming from. At this point, two rounds of the survey have been sent out and we are analyzing the results. In Indiana, 90% of food sales come from out of state purchases. That is to say, only 10% of the food that we eat was grown or processed in Indiana. The money that we are spending on food is not stimulating Indiana’s economy. This statistic is especially shocking considering over three fifths of the land in Indiana is agricultural land. The purchasing of food by K-12 schools, universities, hospitals, and other institutions is incredibly important. For example, more than one million lunches are served in Indiana K-12 schools each day. Considering this enormous purchasing power, a shift in where purchased food is grown would have a substantial impact. Oftentimes, institutions are unaware of how to source food locally. When you are concerned with feeding over 5,000 people each day, it seems a bit cumbersome to switch up where you source your food from. Hopefully this research highlights the opportunities for farmers and institutions to work together. Of course, this could be catalyzed through government policy. Considering this research is modeled after research done on institutional purchasing in Vermont, the possibility exists for Indiana institutions to be incentivized to prioritize purchasing local food.  Co-director Angela Babb was awarded Outstanding Mentor of the Year by Sustain IU in May of this year. The award recognized her many years of researching sustainable food systems and guiding students. Angela is a critical food geographer whose work examines the political economy of hunger and the contemporary food movement. As a postdoctoral fellow, she has mentored four undergraduate students in Sustain IU's Sustainability Scholars program over the last two years. The award noted her constant support of students, offering help whenever needed, and her work on the campus's annual Real Food data analysis.
 by Matt Leetz
I’ve been working in the Critical Food Studies Lab for the past two semesters, or my entire senior year. Over this time, I’ve been building a mathematical spreadsheet model to analyze the presence and intensities of Food Desert regions in the Chicagoland Metropolitan Statistical Area, which covers the area of Chicago as well as its suburbs expanding into Indiana and Wisconsin. I’m interested in utilizing geographic problem solving methods and applying them to human geography, in the hope that we can better understand how these problems come to be and aid in the quest towards food security for all Americans. The end product of this project will be an interactive data model overlaid on a map of the area that highlights where food insecurity is most intense and provide qualitative information about the food vendors that do exist. Last semester was spent collecting data to put into the model. There are five matrices involved in the Maximal Covering Location Problem. We are using the MCLP, introduced by Church and ReVelle in 1974, to solve a discrete (accessible by the network of roads) problem of coverage by locating food facilities within a maximum allowed distance to customers. We set this as an arbitrary drive-time of 20 minutes, which we can increase or decrease as our independent variable. The first matrix is a distance matrix, where we have calculated drive times between all of the Census blocks in the Chicagoland MSA. This by far took the most time to prepare, as the workflow handed down to me involved manually querying each address, receiving a JSON file and extracting information from that into the format we needed. Luckily, we were able to use ArcMap’s Network Analyst function instead, which cut the workload from ~400 hours to 20 minutes. Next comes the population matrix. I was able to collect population data from the US Census Bureau in the form of shapefiles, a filetype used by Geographic Information Software such as ArcMap and QGIS. I was also able to find population centroid data, or the geographically weighted mean of the population of each Census block, and apply it to the shapefiles. With those two out of the way, the other matrices needed are the Constraint matrix (maximum allowed drive time), the Assignment matrix (a way of applying the many internal constraints necessary for the model to function), and the Output matrix (a blank matrix growing impatient to be filled). These were easy to create in Excel this semester, and I have since been cleaning and perfecting the model. This model has nearly 2200 constraints (which I was able to create through a Python script) and 4.7 million variables, making it extremely taxing on computers. We have a specialized computer in the Food Institute now dedicated to running this model as it was built, but at its current rate will take 3-5 months to finish the process. I am now attacking this problem from an alternative route: using Matlab code to perform this process through Mixed Integer Non-Linear Programming, which we can then run on the IU supercomputing cluster through remote access. |
AuthorSThis blog features the current work of CFS Lab researchers in their own words. Archives
October 2021
Categories |
 RSS Feed
